Water use research in agriculture conducted
Published on Feb. 29, 2020
Researchers at the University of Nebraska’s (UNL) Daugherty Water for Food Global Institute concluded water productivity of livestock products improved substantially between 1960 and 2016.
The objective of this study is to assess the water productivity (WP) of the major livestock products in the U.S. and how WP has changed over the last few decades.
“We first characterize each livestock category, estimate the feed conversion ratio and the average volume and composition of the feed consumed by livestock category and then calculate the WP of the livestock products,” says UNL. “The analysis was done for six livestock categories: Beef cattle, dairy cattle, swine, broiler chicken, layer chicken, and turkeys.”
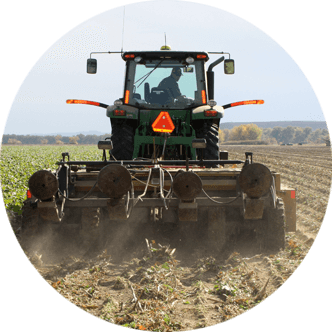
“Water footprint of livestock production has decreased by 36 percent between 1960 and 2016,” says UNL. “Increase in the yield of feedstuffs has helped to lower the footprint of feeds.”
“We consider feed conversion ratios, dry matter intake per head divided by product output per head, feed composition per animal category and estimated the water footprint of livestock production following the Water Footprint Network’s Water Footprint Assessment methodology,” UNL explains.
According to UNL, the current WP of all livestock products appears to be much better than in 1960. Increases in livestock productivity, feed conversion ratios and feed crop yields are all contributing factors.
Population growth and production
Team members note the world population is expected to reach 9.89 billion by 2050, with a majority of growth taking place in urban areas. They estimate the demand for livestock products will increase by 35 percent, which much of this increased demand occurring in developing areas.
“Globally, the livestock sector contributes about 36 percent of the gross value of agriculture production and provides livelihood for farmers and power to developing production systems,” says UNL. “Livestock products supply about 12.9 percent of calories and 27.9 percent of the protein consumed globally.”
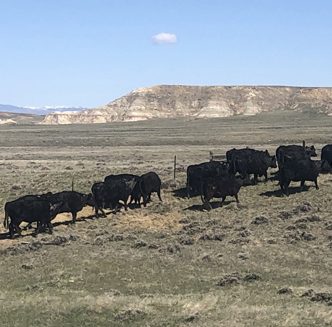
According to UNL, the U.S. is the largest producer of livestock products, accounting for 17 percent of global cattle and chicken meat, 10 percent of pork and 15 percent of milk production in 2016.
“Unless proper policies targeting production systems and consumption trends are put in place, the growth in the livestock sector could put further pressure on already strained natural resources,” says UNL.
Results
The study notes livestock production has increased considerably between 1960 and 2016, with the largest increases being chicken and turkey at 10 and 6.3 percent, respectively.
“Cattle production fluctuated, but had an overall increase of 53 percent,” says UNL.
“Chicken and turkey meat production per animal increased 1.9 and 1.8 times between 1960 and 2016, respectively,” UNL says. “Milk production per dairy cow more than tripled from 1960 to 2016. Cattle, pork and egg production per animal increased by 65 percent, 54 percent and 34 percent, respectively, during the same period.”
According to USDA data, cited in the study, “In 2016, fewer animals were needed to produce a larger amount of animal products. There were 47 percent fewer dairy cows producing 73 percent more milk in 2016 compared to 1960. The number of slaughtered cattle in 2016 was 21 percent more, but produced 53 percent more meat compared to 1960.”
UNL notes improved efficiency in all animal categories has enabled higher production with fewer animals.
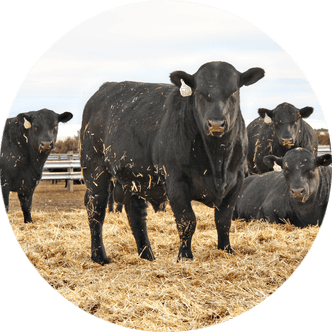
According to the study, beef cattle contributed the most to the total water footprint (WF) of livestock production in the U.S. at 48 percent, followed by dairy cattle at 20 percent, broilers at 14 percent and swine at 12 percent.
“Although beef cattle contribute most to the total WF of livestock production, about 84 percent of the WF is related to forages, pasture and crop byproducts used in production,” says UNL. “The total WF has decreased by 36 percent between 1960 and 2016. This is due to the combined effect of increase in animal productivity, output per head, and the increase in yields of feed crops that resulted in a decrease of average WF of animal feed.”
“This study shows water productivities of all animal products in the U.S. improved since 1960. Compared to 1960, less water was needed per unit of animal product in 2016, about one-half for beef and one-fourth for milk,” UNL says. “The improvement in WP is attributed to a combination of factors: Larger livestock output per head, lower feed requirement per head and larger yields of feed crops.”
“Increases in crop yields helped to decrease the water intensities or WF of the feedstuffs, thus reducing the water required per unit of feed consumed,” UNL concludes.
Callie Hanson is the managing editor of the Wyoming Livestock Roundup. Send comments on this article to roundup@wylr.net.